Run OS X System Profiler From Terminal
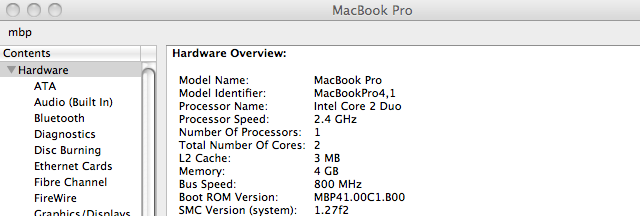
OS X’s built-in System Profiler provides a great graphical display of pretty much anything you’ll want to know about your Mac.

That’s cool and all, but what if you want to access that information programmatically? Turns out you can also run the System Profiler from the terminal by executing this command:
jerod@mbp:~$ /usr/sbin/system_profiler
What’s great about this access method is that it allows you to slurp that data into any other program and have your way with it! For instance, I wanted to track my new battery’s cycle count and charge capacity over time. Why? I dunno, because I’m a geek, okay, get off my back!… Anyways, with the system_profiler command I simply run this little Ruby script every day:
require 'date'

data      = `/usr/sbin/system_profiler SPPowerDataType`
cycles    = data[/Cycle count: (\d+)/, 1]
condition = data[/Condition: (\w+)/, 1]
capacity  = data[/Full charge capacity \(mAh\): (\d+)/, 1]

File.open('/Users/jerod/Documents/battery_history.csv', "a") do |file|
  file.puts "#{Date.today},#{cycles},#{capacity},#{condition}"
end
Ruby uses the (possibly familiar) backticks to capture output from a shell command. All that was left for me to do was to parse the raw data and save it to a CSV file.
Finally, note that the my script is passing SPPowerDataType as an argument which narrows down the returned results. You can learn more about how to use the system_profiler command by readings its manual. Just:
jerod@mbp:~$ man system_profiler